Skip to content
DIAVICON

Diagnostic engineering and building pathology

Run more tests and earn more with diagnostic engineering

From the field to the report, structural diagnosis on a single platform: collect your tests on your phone, get the calculations instantly, see everything on the 3D model of the structure and deliver reports that impress your client.

Freemium plan: free, with 1 user and 250 MB of storage. The platform interface is currently in Portuguese.

Coming soon toGoogle PlayComing soon toApp Store
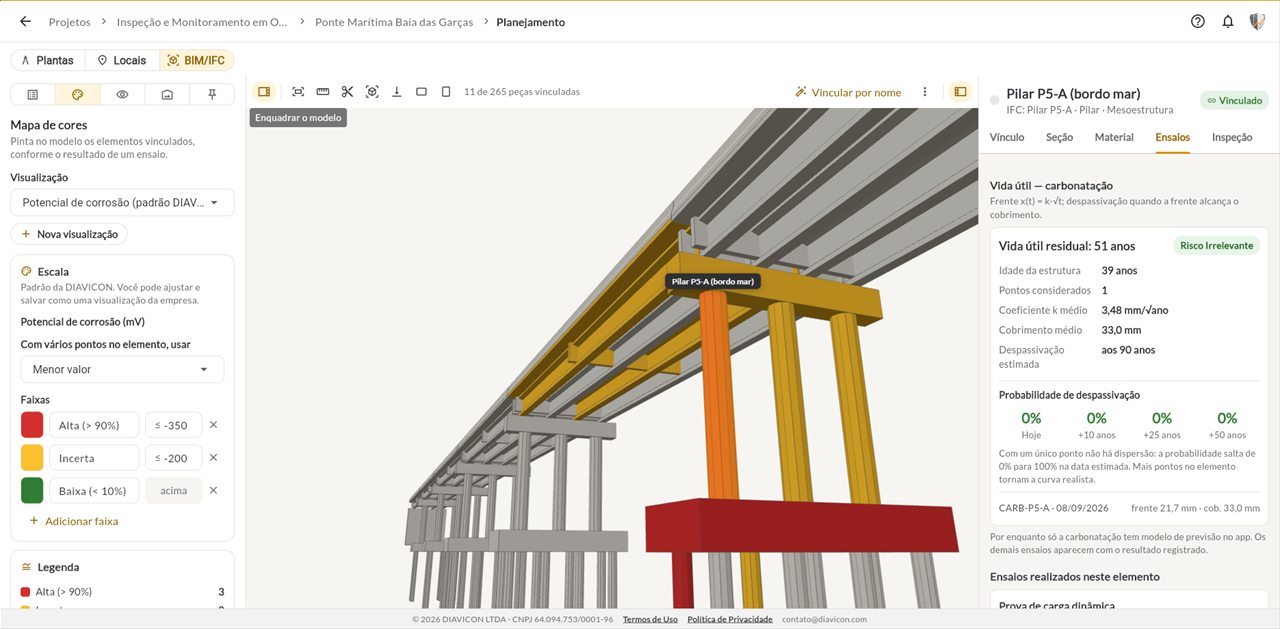
DIAVICON web platform: 3D model of a bridge colored by corrosion potential, showing the remaining service life of a pier
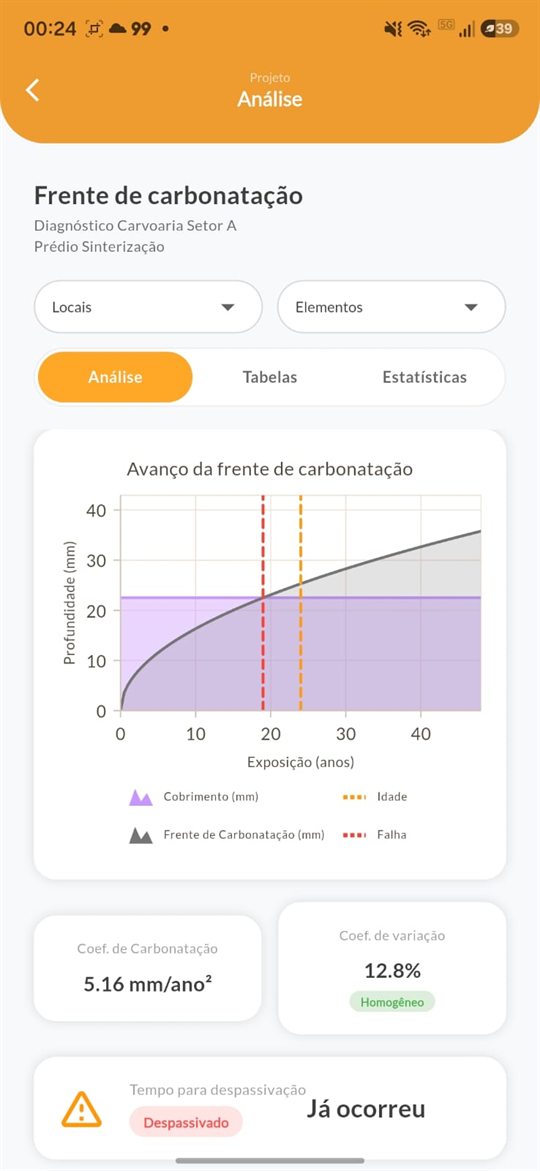
DIAVICON mobile app: analysis of the carbonation front progression

See what you are missing

Every inspection done the old way costs hours you never get back

While data collection, calculations and reports are scattered across paper, spreadsheets and Word, your team works harder to deliver less.

Without DIAVICONWith DIAVICON

Readings written on paper and retyped into a spreadsheet

Readings entered on the phone, at the right point, only once

Loose photos on the phone, renamed one by one

Photos linked to the test point and the structural element

Calculations and charts built by hand back at the office

Calculations, charts and conclusions ready instantly

Report in Word, copied and pasted, days after the site visit

Report generated from the data, or by AI, in PDF and Word

The client receives a PDF and forgets about it

The client follows dashboards and the 3D model of the structure

Stop wasting time: start for free

The role of DIAVICON

From field data to decisions about the structure

DIAVICON connects the stages of the diagnosis, which today are usually scattered across the field notebook, spreadsheets and the report.

  1. Field data collection

    Inspections and tests recorded on the phone, with photos and the position of each point.

  2. Calculation and analysis

    Results calculated per point and for the structure, with charts and conclusions.

  3. Reports and dashboards

    The same data fills in the company report and the project dashboards.

  4. Service life monitoring

    Successive campaigns in the same history show how the structure evolves.

DIAVICON does not replace the engineer. It amplifies your work.

Who it is for

A different gain for each role

Diagnostic engineer

Gain productivity from field to report

Less time typing readings and putting documents together, more time for the diagnosis.

  • Speed up your reports
  • Present and analyze dashboards
  • Share your analyses with your clients
  • Plan your tests and manage the project
See what you gain
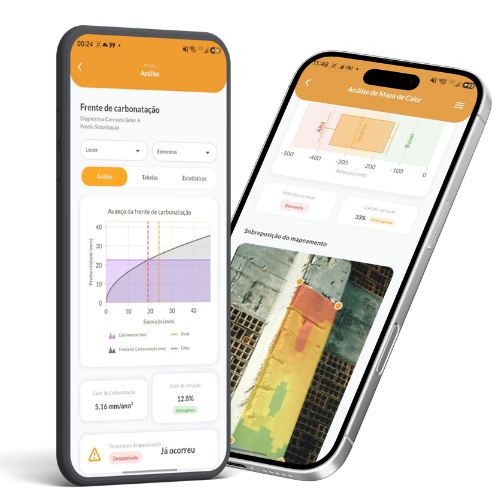
DIAVICON app on two phones: carbonation front progression and corrosion potential heat map

Asset manager

Manage your structures and see in real time the state of durability and integrity

Property managers and area managers keep track of what has been inspected, what has been tested and what has changed.

  • All monitored structures in one place
  • Test and inspection results per structure
  • History to support maintenance decisions
Explore the monitoring dashboard
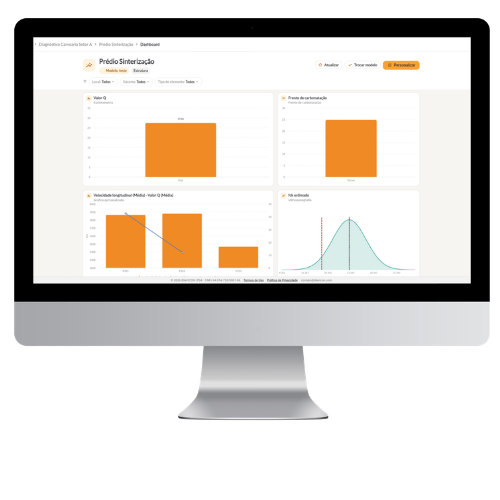
Monitoring dashboard of a structure on the DIAVICON platform, on a monitor

Academic researcher

Turn your field data into research

Data organized for research, model validation and innovation.

  • Standardized readings for each test
  • Series by element and by campaign
  • A basis for validating degradation models
See the supported tests
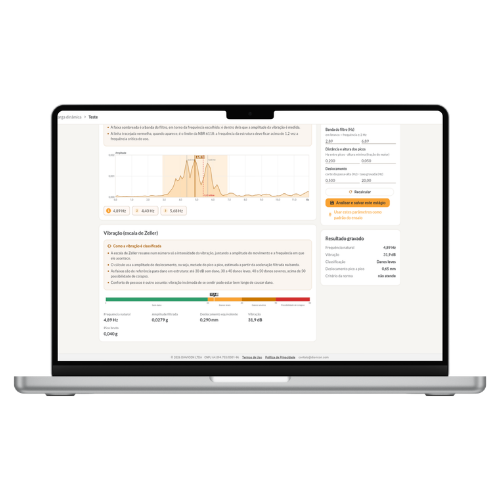
Signal analysis of a test on the DIAVICON platform, on a laptop

Diagnostic engineer

What you gain with DIAVICON

Six areas where the platform takes repetitive work off your daily routine.

Dashboards

Present and analyze dashboards

Bring results together in dashboards by project, by structure or by element, to analyze as a team and present to the client. Each card cross-references the tests and inspections you choose.

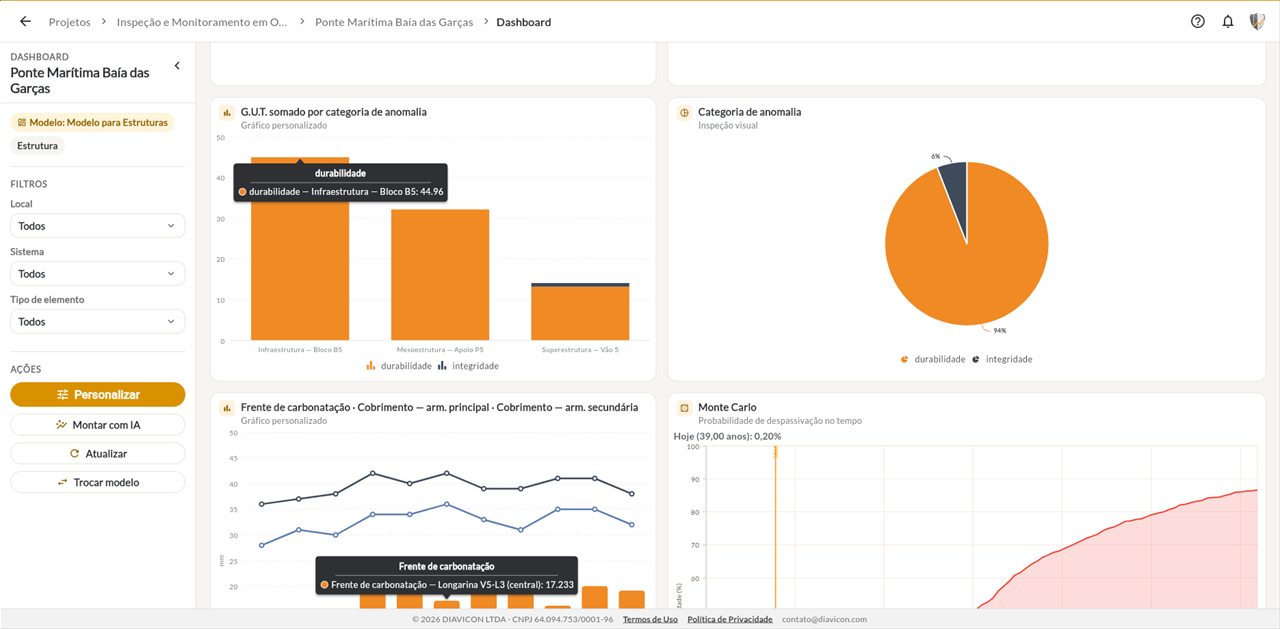
  • Custom charts that combine tests, such as carbonation front and concrete cover
  • GUT score by location and by defect category
  • Probability of depassivation over time, by Monte Carlo simulation
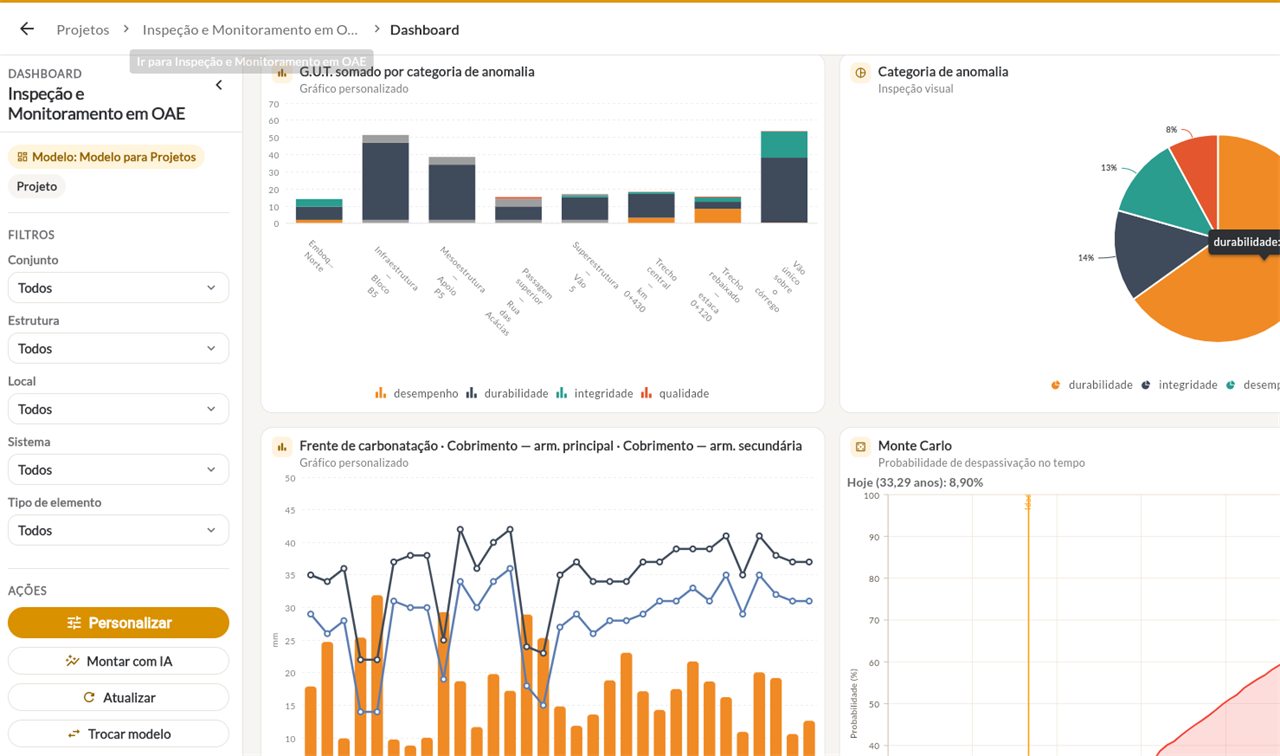
  • Filters by group, structure, location, system and element type
  • Reusable dashboard templates
Explore the monitoring dashboard
Dashboard of a bridge on the DIAVICON platform: GUT score by location, defect category, carbonation front and probability of depassivation
Dashboard of a project with several structures on the DIAVICON platform, with filters by group, structure and location

AI Dashboard

Ask DIAVICÃO for the dashboard and ask questions about the structure

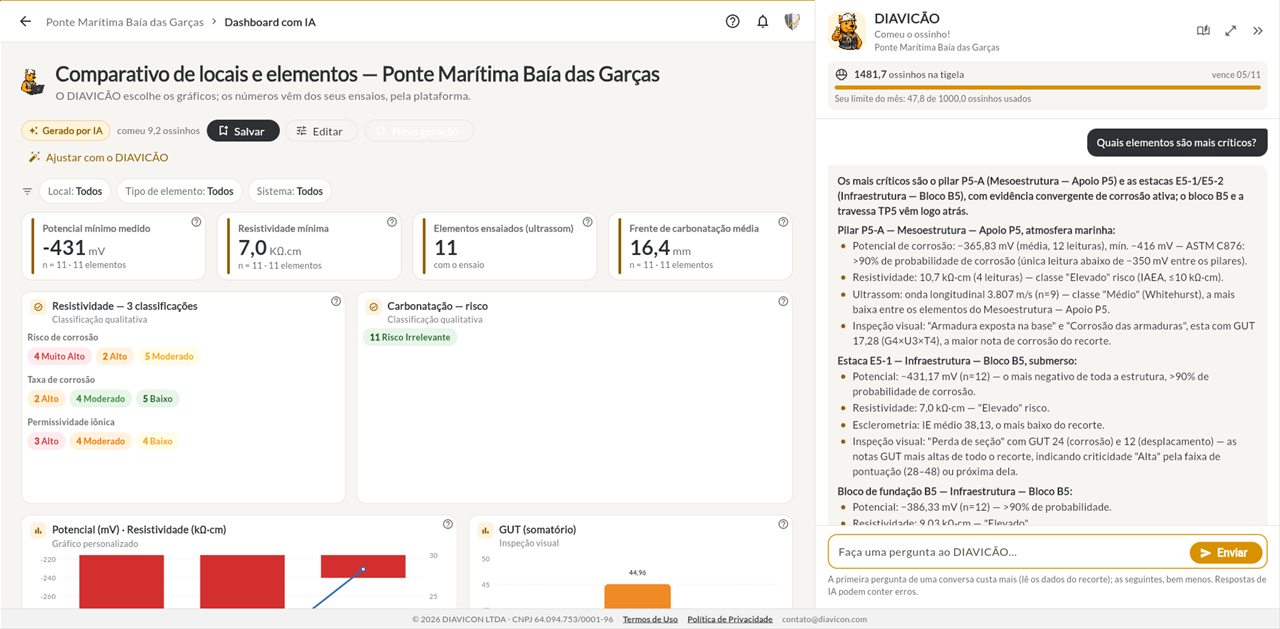
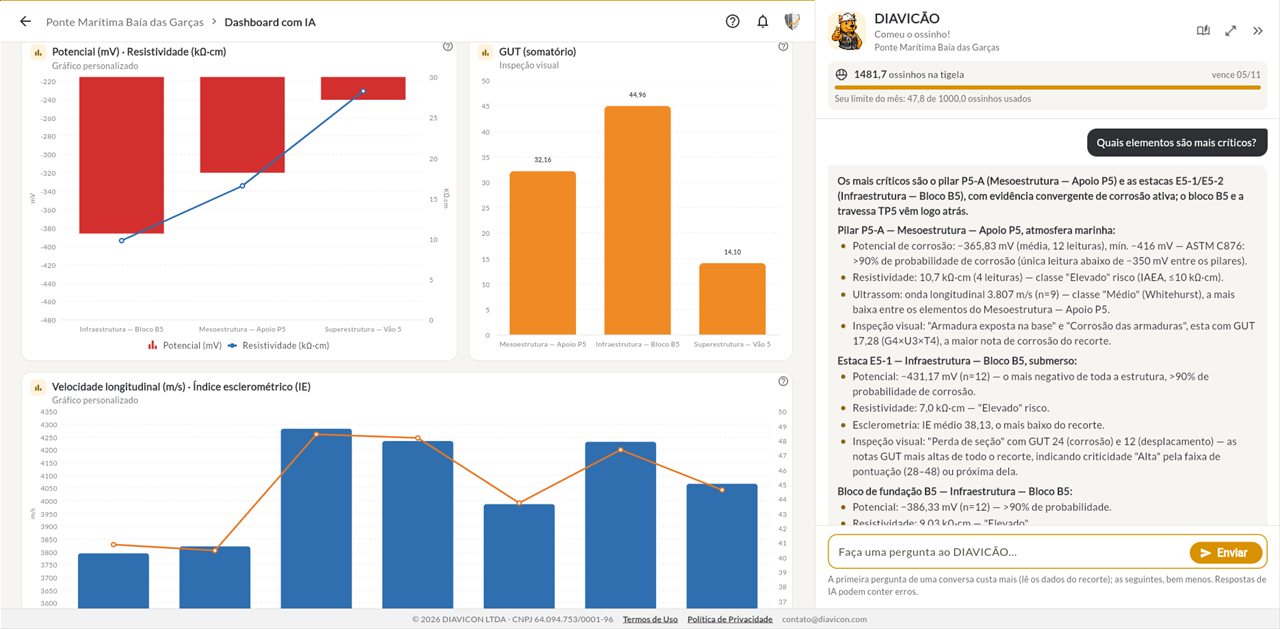
In the AI Dashboard, DIAVICÃO picks the charts and builds the dashboard; the numbers come from your tests, through the platform. Alongside it, you can chat with DIAVICÃO about the results.

  • AI-generated dashboard that you can save, edit or adjust
  • Text questions, such as "Which elements are the most critical?"
  • Answers with the values measured on each element
  • Usage billed in ossinhos (AI credits): 150 per month on the Advanced and Enterprise plans
AI Dashboard on the DIAVICON platform: comparative dashboard of a bridge and a chat with DIAVICÃO about the most critical elements
Charts generated by DIAVICÃO in the AI Dashboard: corrosion potential, resistivity and GUT score by location

Clients

Share your analyses with your clients

Add the client company to the project so it can follow the structures and results on the platform itself.

  • Companies and clients linked to the project
  • Owner client defined for each structure
  • Everyone looks at the same data, with no parallel versions
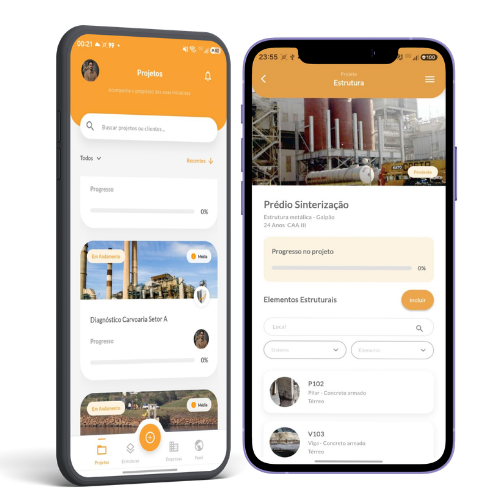
DIAVICON app on two phones: project list and the page of a structure

Planning

Plan your tests and manage your project

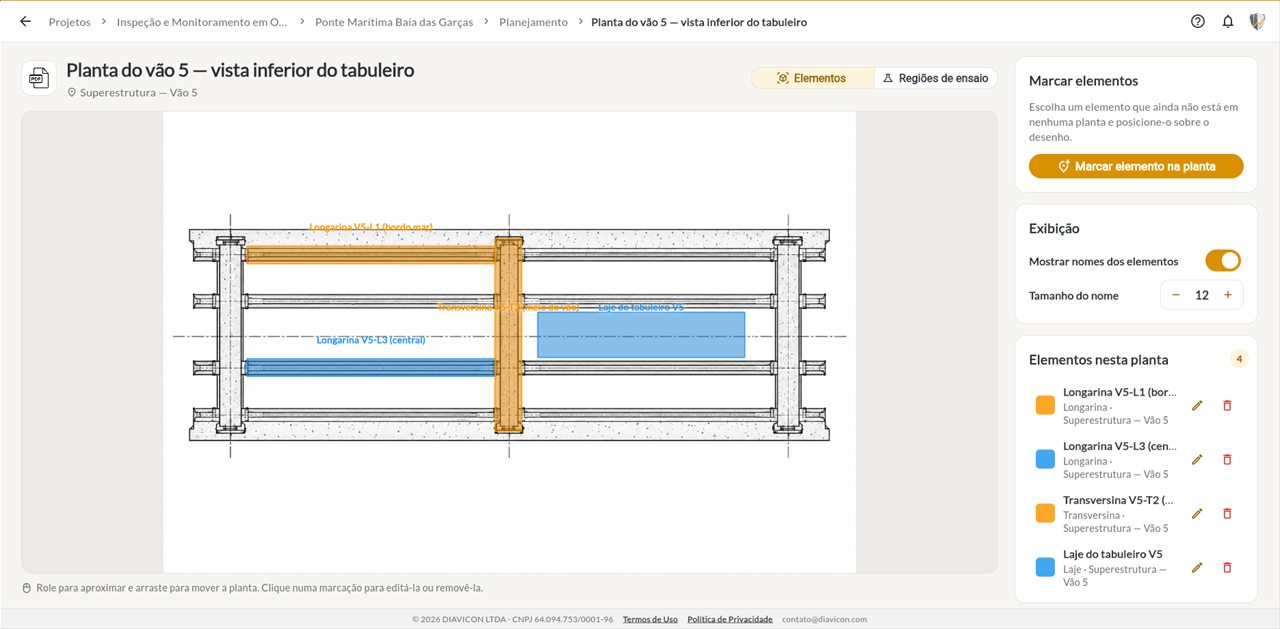
Mark the elements and test areas on the drawing before going to the field, and track what has already been done.

  • Elements and test areas marked on the drawing
  • Contracted and completed tests per structure
  • Team and project progress on one screen
Explore the web app
Planning on the DIAVICON platform: elements marked on the floor plan

BIM/IFC

See the results on the 3D model of the structure

Upload the structure model in .IFC or .GLB, with photogrammetry, and see each element colored by the results of the tests and the visual inspection.

  • Color map by test or by GUT score
  • Tests, inspection and remaining service life when you click on a member
  • Available on the Enterprise plan
Explore the 3D model
3D model of a bridge on the DIAVICON platform, with elements colored by corrosion potential and the test panel of a pier

Reports

Speed up your reports

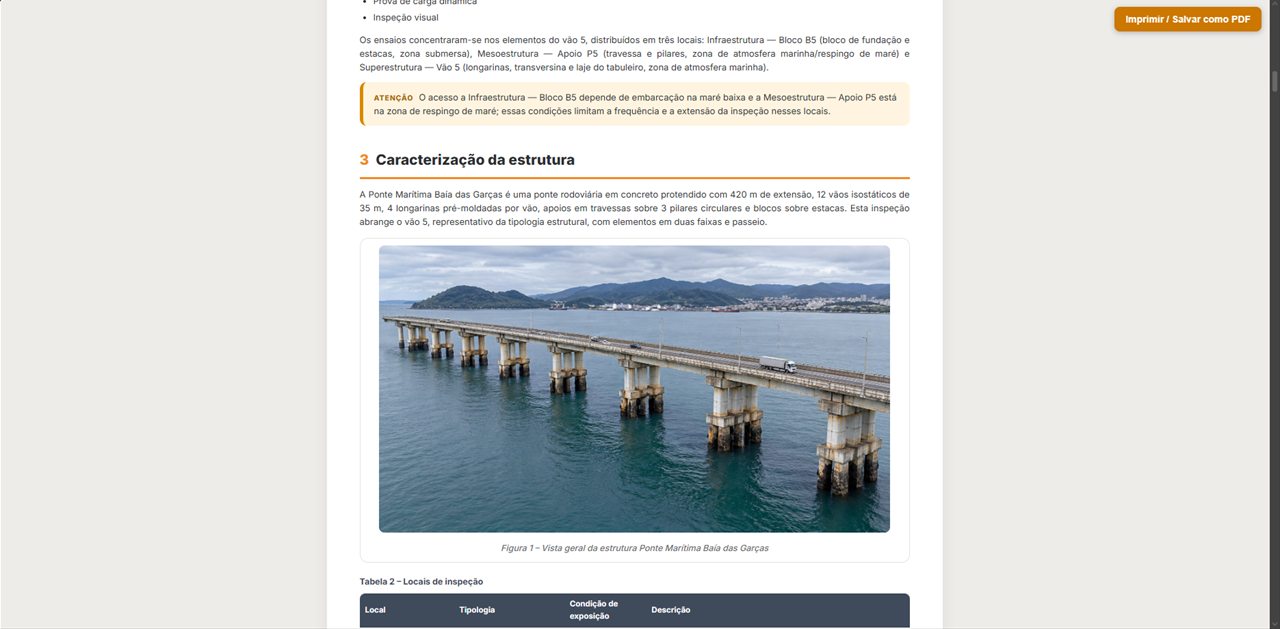
Set up your company's report template once, or ask DIAVICÃO for the report. The data collected in the field fills in the document; you review and sign.

  • Report templates for each type of test
  • AI report ready for review, or in your company's format based on your own Word or PDF template
  • Output in PDF, with cover, table of contents, highlights and charts, and in Word (.docx)
  • No copying and pasting from the field into the document
Bridge inspection report generated with AI on the DIAVICON platform, with text, photo and table
AI report on the DIAVICON platform: choice between the DIAVICÃO report and your company's format, and the level of detail

Services

Technical expertise applied to real market challenges

Beyond the platform, DIAVICON offers specialized services to support diagnostic engineers in data analysis, diagnosis, repair and monitoring of structures.

Intelligence for structural diagnosis

  • Technical analysis of structural test data
  • Analysis of laboratory data on cementitious materials
  • Test-based structural diagnosis
  • Technical review and auditing of reports

Service life, durability and prognosis

  • Service life and structural degradation modeling
  • Structural degradation prognosis
  • Durability and deterioration kinetics studies

Consulting and methodology standardization

  • Consulting on structural tests
  • Inspection and testing plans and methodologies
  • Implementation of structural management
  • Digitization of structural records

Training and professional development

  • Training in diagnostic engineering
  • Training in structural tests
  • Technical workshops
  • Mentoring for early-career engineers

Talk to DIAVICON

Achievements

Science, academia and investment behind the platform

Patent seal

Patented process

A test data analysis model for modeling structural degradation.

INOVALAB program, from UFMG

Spin-off UFMG

Born at the university, supported by CTIT-INOVA, and awarded in its incubation program.

Koinz Capital

Backed by Koinz Capital

Investment to accelerate the development of the platform.

Free trial

Start on the Freemium plan and upgrade when you need to

Use DIAVICON on a real project before you decide. As your operation grows, the paid plans add offline work, more users and storage, reports, dashboards, AI and structure monitoring.

Compare all plans
DIAVICÃO, the DIAVICON mascot, using the platform on a laptop

Freemium plan

Free

  • 1 user
  • 250 MB of storage
  • Full analyses
  • Online use only
Try it free

Questions

Frequently asked questions about DIAVICON

DIAVICÃO, the DIAVICON mascot, wearing a headset and answering on a laptop

Didn't find your question?Write to contato@diavicon.com.

What is DIAVICON?

DIAVICON is a digital platform for diagnostic engineering. It organizes visual inspections and tests on structures by project, structure and element, calculates the analyses, displays the results in dashboards and generates reports, on your phone and on your computer.

What is diagnostic engineering?

It is the field of engineering that investigates the condition of a construction, through inspections, tests and analyses, to identify pathological manifestations, their causes and expected evolution, and thereby guide maintenance and repair.

Who is DIAVICON made for?

For diagnostic engineers, structural asset managers, such as property managers and area managers, and researchers who work with the durability and service life of structures.

Is DIAVICON free?

The Freemium plan is free and includes 1 user, 250 MB of storage and full analyses, with online use. The paid plans, starting at R$ 249.90 per month, add offline work, more users, reports, dashboards, AI and structure monitoring.

Which tests does the platform support?

Visual inspection and integrity tests (rebound hammer test, ultrasonic pulse velocity, core extraction, crack monitoring, load tests and liquid penetrant), durability tests (carbonation, corrosion potential, electrical resistivity and chlorides) and quality tests (mortar and ceramic tile bond strength and anchor pull-out test).

Does DIAVICON replace the engineer?

No. The platform organizes the data, performs the calculations and supports the interpretation; the diagnosis and the technical responsibility remain with the engineer.


Stop losing hours on spreadsheets and reports

Create your free account now and run your next inspection on DIAVICON. Your team delivers more, and your client sees the difference.

Try it free
DIAVICÃO, the DIAVICON mascot, giving a thumbs up

Follow us

Technical content and DIAVICON news.

Free Freemium plan Try it free